Now that you can fine-tune large language models (LLMs), they’re more adaptable and can be tailored for specific tasks. However, fine-tuning LLMs requires a large amount of data in order to train the model to generate customized and domain-specific responses.
Web scraping gives you the ability to automatically gather the data you need to fine-tune your LLM. With web scraping, you can target websites to extract relevant data and ensure that your LLM encounters the language and style you need.
In this tutorial, you’ll learn how to scrape the content of a website using Beautiful Soup and Selenium. By the end of the article, you’ll have a better understanding of web scraping in Python and how it can help you fine-tune your LLM.
What Is Web Scraping?
Web scraping involves using specialized software or scripts to navigate through web pages, locate specific information, and then gather that data into a structured format (such as a spreadsheet, JSON, or database).
Web scraping is used in all kinds of scenarios. For example, First Bite scraped data from around a million US restaurants to create a food service platform for lead collection for food suppliers and distributors.
Web Scraping and LLMs
If you’re trying to improve the accuracy of your LLMs, you need to make sure you’re scraping up-to-date data. LLMs used for customer support benefit from being trained on the latest organizational data. This up-to-date data helps generate precise responses, ultimately improving the quality of service.
When you need to gather in-house data from internal knowledge bases or build a data set of a specialized external source, two popular Python web scraping tools will be able to handle the task.
Popular Python Web Scraping Tools
Python offers many tools for web scraping, but two popular ones are Beautiful Soup and Selenium.
Beautiful Soup is a Python library used to extract text from HTML and XML data. It parses an HTML tree and provides various methods to navigate and extract data from that tree. It’s generally used to extract data from a static page, meaning it doesn’t work with data rendered on the client side using JavaScript.
In contrast, Selenium is a browser automation tool that interacts with a website programmatically. It retrieves information by replicating user interactions like keyboard input and mouse clicks. It helps users gather data rendered by client-side JavaScript or data behind paywalls.
Implementing Web Scraping with Python
So, let’s create a web scraping solution from scratch with both Selenium and Beautiful Soup. All the code is available in this GitHub repository.
Prerequisites
Before you begin this tutorial, make sure you have the following:
- Python 3.9 or above installed on your system
- A virtual environment to isolate your project dependencies
In addition to Python and a virtual environment, you need to install a few packages using pip. To do so, run the following command in your terminal:
pip install beautifulsoup4 requests seleniumThis command installs the following packages:
requests, which is used to send HTTP requests to the server to obtain HTML pagesbeautifulsoup4, which is used to traverse the HTML tree and extract information from a web pageselenium, which is used to automate browsers and interact with websites via keyboard events and mouse clicks
Scraping a Website with Beautiful Soup
Beautiful Soup retrieves web page content through various methods, including CSS classes and IDs, XPath, or HTML tags. We’ll be scraping data from a sandbox bookstore website specifically designed for web scraping. Here, you’ll extract all the book data into a JSON file.
Analyzing Your Target Website
When web scraping, before writing any code, you need to analyze the website you’re going to scrape to pinpoint the relevant data. To do this, all you need to do is right-click the website and select Inspect. This action opens a developer tools window that displays the HTML code utilized to render the website.
To view the classes or IDs of individual books, you need to click the arrow icon in the top-left corner of the developer tools window:
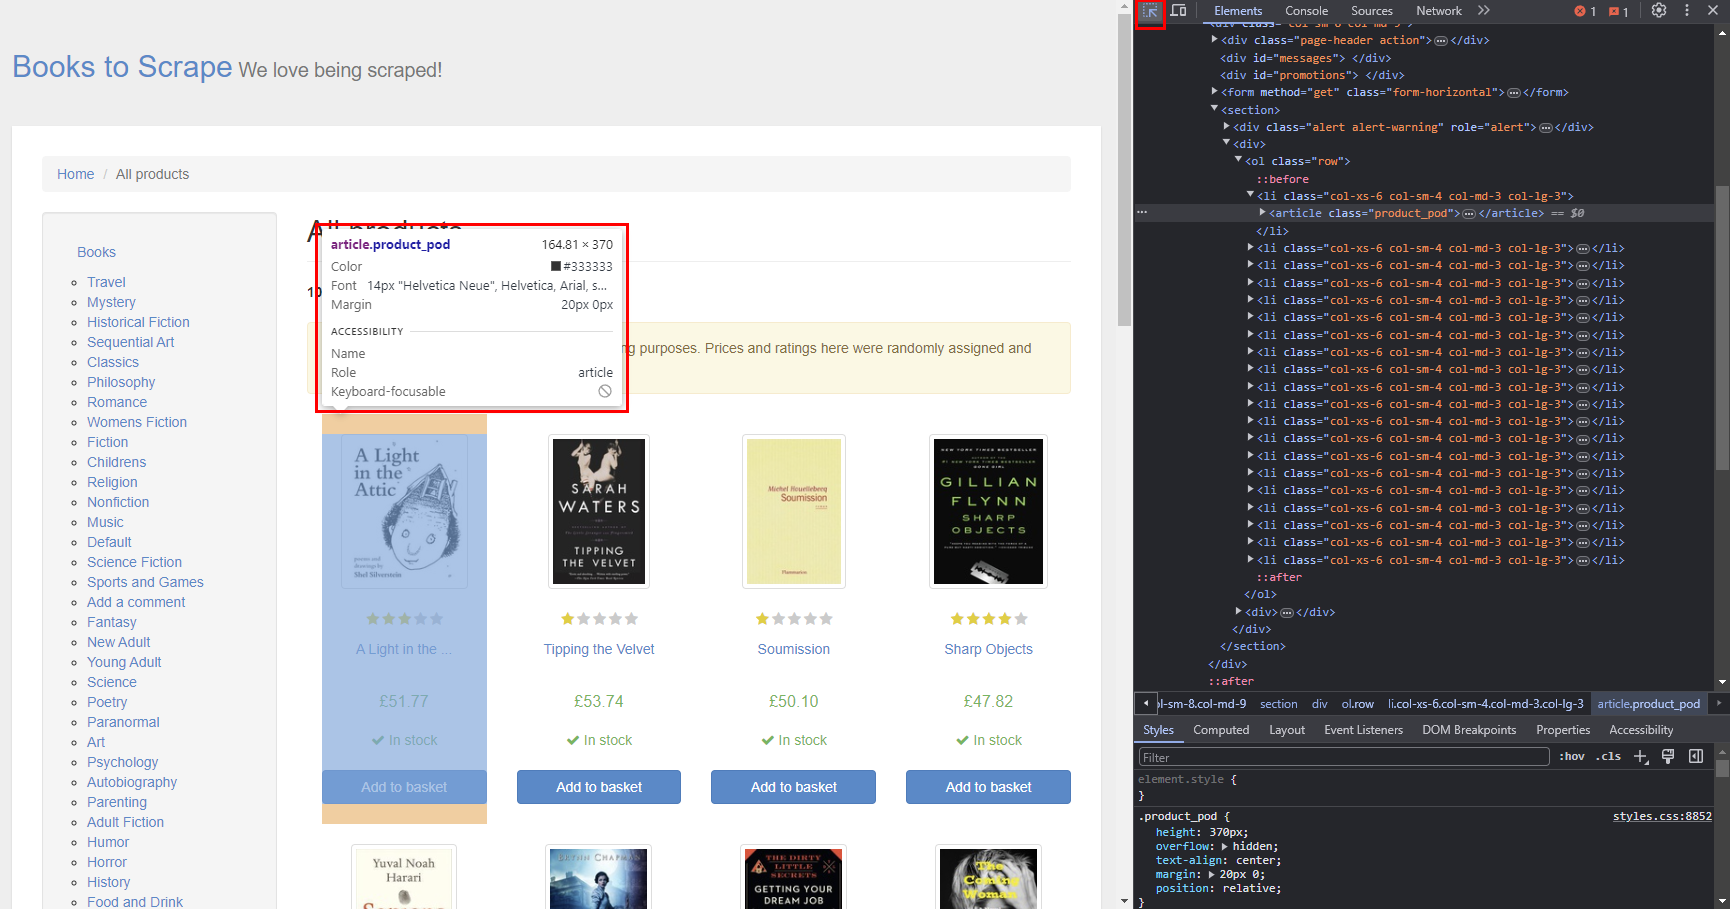
You can access an element’s details simply by hovering over it.
We will scrape the URL, title, and price of each book. Here, you can see that each book is encapsulated within an <li> tag:
<li class="col-xs-6 col-sm-4 col-md-3 col-lg-3">
   <article class="product_pod">
      <div class="image_container">
         <a href="in-her-wake_980/index.html"><img src="../media/cache/5d/72/5d72709c6a7a9584a4d1cf07648bfce1.jpg" alt="In Her Wake" class="thumbnail"></a>
      </div>
      <p class="star-rating One">
         <i class="icon-star"></i>
         <i class="icon-star"></i>
         <i class="icon-star"></i>
         <i class="icon-star"></i>
         <i class="icon-star"></i>
      </p>
      <h3><a href="in-her-wake_980/index.html" title="In Her Wake">In Her Wake</a></h3>
      <div class="product_price">
         <p class="price_color">£12.84</p>
         <p class="instock availability">
            <i class="icon-ok"></i>
            In stock
         </p>
         <form>
            <button type="submit" class="btn btn-primary btn-block" data-loading-text="Adding...">Add to basket</button>
         </form>
      </div>
   </article>
</li>
Each product resides within an <article> tag with the class product_pod. Within this tag, you can extract the title and book URL from an <h3> tag. The price is located within a <p> tag with the class price_color.
Now that we’ve identified the elements to scrape, let’s create a script that automates the scraping process.
Creating a Scraping Script
To create a scraping script, open your project directory and create a new file called beautifulsoup_scrape.py. Open this file and add the following code:
from bs4 import BeautifulSoup
import requests
import json

ENDPOINT = "https://books.toscrape.com/catalogue/page-1.html"
This code imports the necessary packages for your script. The ENDPOINT variable specifies the web page you intend to scrape (ie the first page of the catalog of books). Next, let’s retrieve the html::
html_response = requests.get(ENDPOINT).text

html_soup = BeautifulSoup(html_response, 'html.parser')
This code sends a query to the specified endpoint, storing all the HTML response code within the html_response variable. Subsequently, a new BeautifulSoup object is created in the html_soup variable to parse the HTML response for queries.
Next, you need to search the HTML response for the relevant elements. To do so, add the following code in the script file:
products = html_soup.find_all('article', class_='product_pod')
products_data = []
The find_all function of the html_soup object recursively searches the HTML response and creates a list of all the elements that pass the given conditions as arguments. In this case, you’re searching all the <article> tags with the class product_pod. You also declare an empty list, where you’ll store all the books’ data.
To collect data, append your script with the following code:
for product in products:
    book_data = {
        'url' : "https://books.toscrape.com/" + product.h3.a['href'],
        'title': product.h3.a['title'],
        'price': product.find('p', class_='price_color').text
    }
    products_data.append(book_data)
Here, each product container is iterated over, and the URL, title, and price are scraped from each <article> tag container. Within Beautiful Soup, child elements of the parent tag can be accessed using dot notation, while attributes of the tag can be accessed like dictionary elements in Python, as demonstrated by extracting the URL and title of the book.
The find function is used to extract the price of the book, which returns the first element satisfying the specified conditions; in this case, it’s a <p> tag with the class price_color. Subsequently, the text attribute is invoked to retrieve the text within the element.
At this point, you’re almost finished. You just need to store the scraped data. Since it’s structured record-type data, it makes sense to store it in JSON format:
with open('books.json', 'w') as f:
    json.dump(products_data, f, ensure_ascii=False)
The json.dump() function serializes the products_data list, which contains all the scraped book information in a JSON-formatted string. This JSON string is then written to books.json via the file object f created using the open() function. The w mode ensures that the file is opened for writing, which allows the JSON data to be written into it. By setting ensure_ascii=False, non-ASCII characters are preserved without escaping, ensuring the accurate representation of textual data.
Now, let’s run the script.
Running the Script
Use the following command to run the script:
python beautifulsoup_scrape.pyIn just a few seconds, you’ll see a new file named books.json created next to your script file.
To review the output data, open the books.json file:
[
    {
        "url": "https://books.toscrape.com/a-light-in-the-attic_1000/index.html",
        "title": "A Light in the Attic",
        "price": "£51.77"
    },
    {
        "url": "https://books.toscrape.com/tipping-the-velvet_999/index.html",
        "title": "Tipping the Velvet",
        "price": "£53.74"
    },
← output omitted →
]
As you can see, all the data has been stored as a JSON file.
Scraping a Dynamic Website with Selenium
If you’re looking to scrape dynamic content or content rendered with JavaScript, Beautiful Soup may not be the best option. Selenium, on the other hand, provides fine-grained control over the browser by programmatically interacting with it. It works by sending user commands to the browser driver, which are then translated into actions to execute mouse clicks and keyboard inputs.
Let’s scrape the freeCodeCamp YouTube channel. This involves scraping the top hundred recently uploaded videos, capturing each video’s URL, title, duration, upload info, and views. Scraping YouTube videos is a complex process because the content is dynamically loaded as users scroll down to view more videos. Selenium handles this dynamic behavior by replicating user scroll interactions. As before, you must analyze the website to pinpoint all the elements that you want to scrape.
Analyzing the freeCodeCamp YouTube Channel
When you access developer tools for the freeCodeCamp YouTube channel, you’ll notice the structure of the HTML is much more complicated than for the Books to Scrape website. As before, utilize the hover-to-inspect feature to pinpoint the tags responsible for rendering each web element:
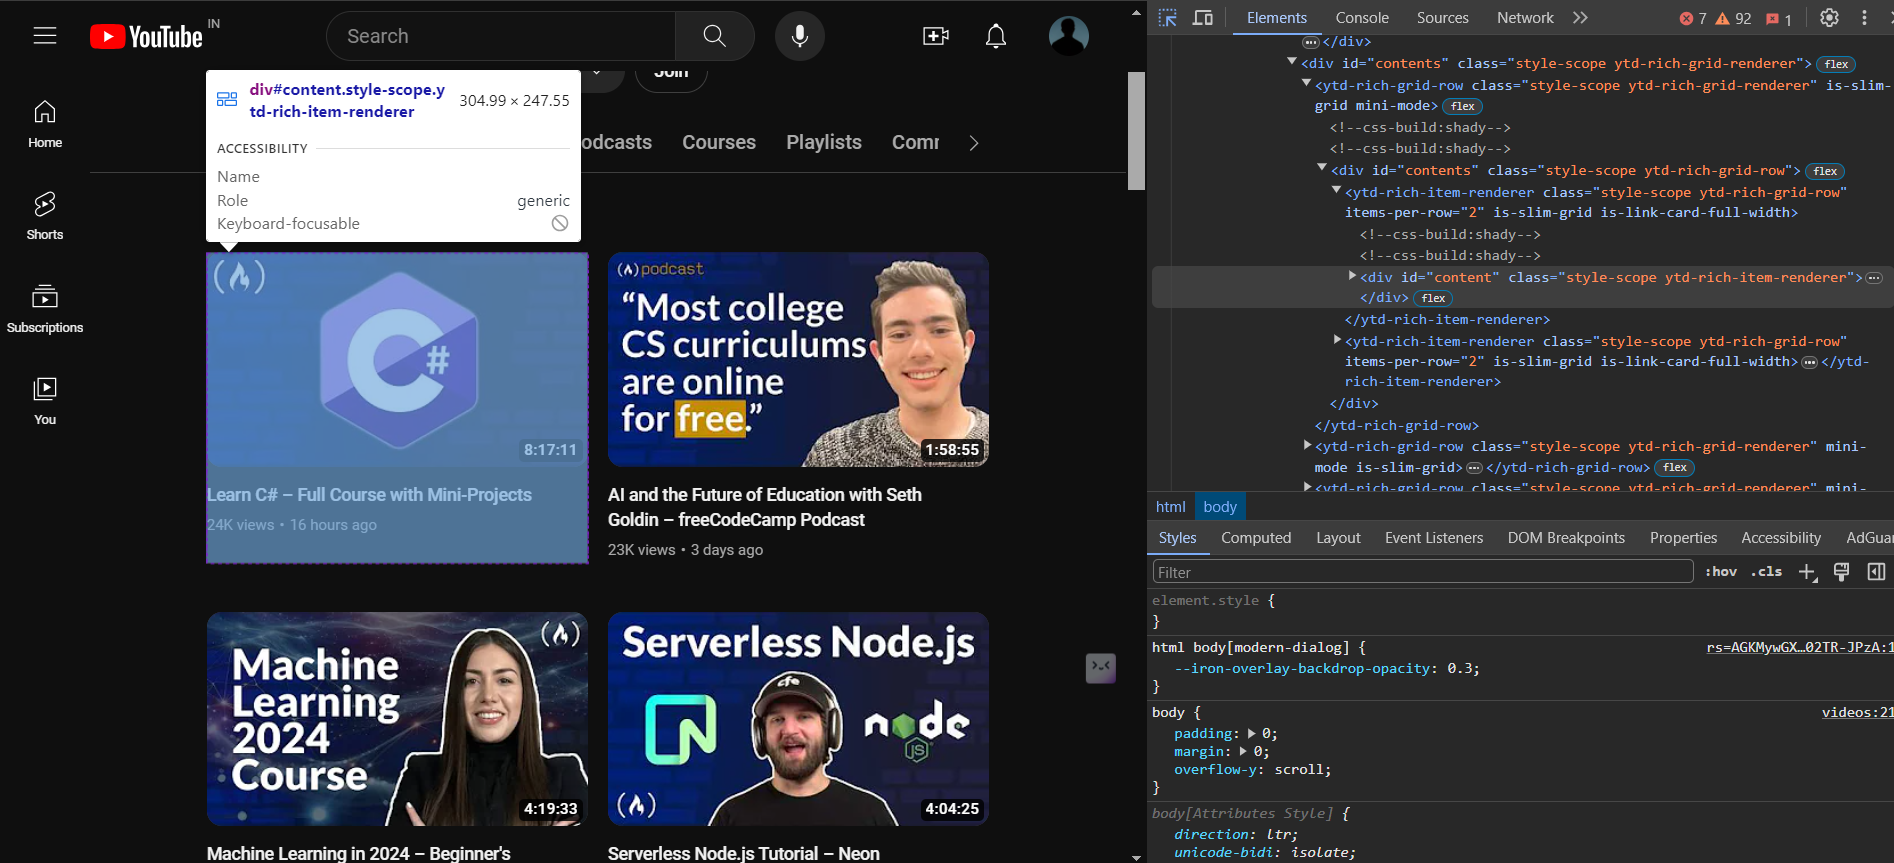
Using developer tools, you can see that each video container is encapsulated within a ytd-rich-grid-media tag:
<div id="time-status">
<yt-icon size="16"></yt-icon>
<span id="text" aria-label="8 hours, 17 minutes, 11 seconds">
    8:17:11
  </span></div>
This code segment contains the duration of the video, with the time specified within the aria-label attribute of the span tag. In this tutorial, you’ll extract the value from the aria-label attribute.
Next, you need to identify elements to extract the URL and title:
<a id="video-title-link" href="/watch?v=YrtFtdTTfv0" ><yt-formatted-string id="video-title" >
Learn C# – Full Course with Mini-Projects
</yt-formatted-string></a>
You can extract the href attribute of the a tag with the ID video-title-link, along with the tag’s inner text, to obtain the video title.
To retrieve views and upload data for the video, you’ll target the following code:
<span class="inline-metadata-item style-scope ytd-video-meta-block">27K views</span>
<span class="inline-metadata-item style-scope ytd-video-meta-block">20 hours ago</span>
You’ll extract text from a span with the class inline-metadata-item.
Creating a Scraping Script
Create selenium_scrape.py with the following code:
from selenium import webdriver
from time import sleep
import json
from selenium.webdriver.common.by import By
from selenium.webdriver.common.keys import Keys
We import the webdriver module from the package. This module contains web browser drivers that you’ll use to instantiate a new browser and automate it. The sleep function pauses the execution of the script while the web page loads. Then, the json module stores the scraped data as a JSON file.
The By class is imported to help select specific elements on web pages, while the Keys class is imported to enable keyboard interactions with web elements.
Next, you need to create a new Chrome browser instance to control the browser and interact with the specified URL programmatically:
ENDPOINT = "https://www.youtube.com/@freecodecamp/videos"
videos_data = []

driver = webdriver.Chrome()
driver.get(ENDPOINT)
sleep(3)
ENDPOINT is created to hold the URL of the freeCodeCamp YouTube page. A videos_data list is initialized to store data related to videos. Then, a Chrome WebDriver instance is initialized using webdriver.Chrome(). After that, the WebDriver navigates to the specified endpoint URL using driver.get(ENDPOINT). Finally, a pause of three seconds is introduced to ensure that the page is fully rendered before accessing any elements.
After the web page has finished loading in the browser, you’ll need to scroll to the bottom of the page four times. As mentioned earlier, YouTube is dynamic, and additional videos are loaded onto the page only when you reach the bottom. To simulate scrolling, you’ll programmatically press the End key on the page:
html = driver.find_element(By.TAG_NAME, 'html')
for i in range(4):
    html.send_keys(Keys.END)
    sleep(3)

video_elements = driver.find_elements(By.TAG_NAME, 'ytd-rich-grid-media')
In this code, the find_element function selects the html tag, which returns the first web element satisfying the specified criteria (in this case, based on the TAG_NAME of html). Subsequently, the End key is programmatically pressed four times to load the required number of videos onto the page. Each key press is followed by a three-second pause using the sleep function to ensure that the videos are fully loaded before proceeding. Following this, all individual video containers enclosed within the ytd-rich-grid-media tag are selected using the find_elements function. Since there are multiple videos on the page, this function returns a list of web elements, which is how Selenium represents an individual HTML element on the page.
Next, you need to extract data from each video container using custom selectors. To do this, update your script with the following code:
for video in video_elements:
    container = video.find_element(By.XPATH, './/div[@id="dismissible"]')
    url = container.find_element(By.XPATH, './/a[@id="video-title-link"]').get_attribute('href')
    duration = container.find_element(By.XPATH, './/div[@id="time-status"]/span').get_attribute('aria-label')
    title = container.find_element(By.XPATH, './/h3/a/yt-formatted-string').text
    metadata = container.find_elements(By.CSS_SELECTOR, 'span.inline-metadata-item')
    views = metadata[0].text
    uploaded = metadata[1].text
    videos_data.append(
        {
            "url": url,
            "duration":  duration,
            "title" : title,
            "views": views,
            "uploaded" : uploaded
        }
    )

driver.close()
Here, each video element is iterated over to extract its data and store it as a dictionary in the videos_data list. Initially, an XPath selector is used to pinpoint a div with the ID dismissible, which narrows down the search area for essential values such as the title and URL. This container element serves as the basis for extracting additional data.
The URL is retrieved by navigating within the container element and locating the a tag with the ID video-title-link, from which the value of the href attribute is extracted using the get_attribute function to obtain the URL. Similarly, the duration is obtained by accessing the aria-label attribute of the span tag within the div with the ID time-status. The video title is contained within a yt-formatted-string tag, which is extracted using the text attribute (as the title resides within the inner text of the tag).
Both the views and uploaded values are encapsulated within similar tags with the same CSS class. This is why both values are extracted simultaneously using the find_elements function. Each value is extracted by accessing it through list indexing and invoking the text attribute on each element.
Once you collect all the values, they’re stored as a dictionary within a list. After iteration over all elements is complete, the browser window is closed by invoking the close function on the driver.
At this point, all the extracted data is stored within the videos_data list. Your next step is to save this data into a JSON file by appending your script with the following code:
with open('videos.json', 'w') as f:
    json.dump(videos_data, f, ensure_ascii=False)
Here, you create a new file called videos.json and store all the data from videos_data as JSON inside the file.
Analyzing the Data
To verify the output of your script, open your terminal and execute the following command:
python selenium_scrape.pyAfter running this command, a new Chrome window is launched that displays the freeCodeCamp YouTube page. For a brief moment, the window automatically scrolls to the bottom of the page to load an adequate number of videos. After a few seconds, the window closes, and you’ll see a new file named videos.json.
Open this file. You should see something like this:
[
    {
        "url": "https://www.youtube.com/watch?v=OHvfgaDl-yY",
        "duration": "5 hours, 12 minutes, 47 seconds",
        "title": "Task Manager Coding Project Tutorial � Next.js, React, Prisma, MongoDB",
        "views": "17K views",
        "uploaded": "16 hours ago"
    },
    {
        "url": "https://www.youtube.com/watch?v=YrtFtdTTfv0",
        "duration": "8 hours, 17 minutes, 11 seconds",
        "title": "Learn C# � Full Course with Mini-Projects",
        "views": "40K views",
        "uploaded": "1 day ago"
    }
← output omitted →
]
This output contains all the relevant video information from the freeCodeCamp channel.
Conclusion
In this tutorial, you’ve learned how to harness Python for web scraping, using Beautiful Soup to efficiently extract data from static pages and Selenium for dynamic content requiring interaction. Choose Beautiful Soup when dealing with straightforward data extraction and opt for Selenium when you need to navigate through or interact with web pages dynamically. These tools are essential for compiling targeted datasets necessary for fine-tuning AI models to specific domains or tasks and for lots else besides.
Earthly Cloud: Consistent, Fast Builds, Any CI
Consistent, repeatable builds across all environments. Advanced caching for faster builds. Easy integration with any CI. 6,000 build minutes per month included.