Build a Data Dashboard with Streamlit in Python
Table of Contents
The Streamlit dashboard tutorial teaches efficient data visualization project builds. Streamlit users will find Earthly streamlines app development. Check it out.
Streamlit is an open-source Python framework that lets you turn data scripts into shareable web apps in minutes. Streamlit makes it easy for data scientists and analysts to create and deploy interactive visualizations and dashboards for machine learning models and other Python applications.
You need almost no experience with building front ends to get started with Streamlit. It is designed to do the heavy lifting of generating an intuitive and responsive interface from a simple Python script.
This tutorial will teach you how to build a dashboard for a Github dataset of movie records. You’ll then learn how to deploy the web app and interactively explore the dataset, visualize, and retrieve information from it.
Why Should You Use Streamlit?
There are several reasons to choose Streamlit for data visualization. Some of them include:
Streamlit is written for Python and is compatible with major Python libraries for data analysis and machine learning. The Streamlit interface is intuitive and user-friendly. Streamlit dashboards can be hosted on Streamlit Cloud. You can configure Streamlit to monitor the GitHub repository where the code and data are hosted, and update the web app when changes are made to the repository.
Installing Streamlit
Before we get started, you should know that you need a good understanding of data analysis and visualization in Python. This is because Streamlit only lets you embed your visualization within its framework and display them as web apps; you still need to analyze the data and meaningfully visualize it.
From the command prompt, install Streamlit using pip by running the following command:
pip install streamlit To check if the installation worked, create a new Python script in your editor, import streamlit under the alias st, and use the write function to print out some text. The st.write() function is used to display information like text, dataframes, or figures.
import streamlit as st
st.write("Hello World!")
st.write("Hello Streamlit!")
Run the app on your browser (in your command prompt, change the directory to the folder where your file is located) by running this command:
streamlit run file_name.pyThis will automatically open a tab in your browser.

If you get this output, your installation works and you are ready to use Streamlit.
Plotting With Streamlit
You can find the code for this project on Github and the real-time application on Streamlit Cloud.
Adding a Matplotlib Chart
st.pyplot() is the Streamlit function to create figure objects and plots. To create a matplotlib visualization, you have to perform data analysis and then create the visualization. For this section, we will use this movie industry dataset from Github.
This dataset contains over 7000 movie entries—from the period 1986-2016—scraped from IMDb (Internet Movie Database). It lists movies of different genres and countries. I’ll be using this dataset to create different interactive plots for this tutorial.
import streamlit as st
import pandas as pd
import matplotlib.pyplot as plt
We use the pandas read_csv() function to read in the data into a dataframe.
#read in the file
movies_data = pd.read_csv("https://raw.githubusercontent.com/danielgrijalva/movie-stats/7c6a562377ab5c91bb80c405be50a0494ae8e582/movies.csv")
To generate a summary of the dataset and check for missing values and duplicates, we’ll use the following functions:
movies_data.info()#output
<class 'pandas.core.frame.DataFrame'>
RangeIndex: 7668 entries, 0 to 7667
Data columns (total 15 columns):
# Column Non-Null Count Dtype
--- ------ -------------- -----
0 name 7668 non-null object
1 rating 7591 non-null object
2 genre 7668 non-null object
3 year 7668 non-null int64
4 released 7666 non-null object
5 score 7665 non-null float64
6 votes 7665 non-null float64
7 director 7668 non-null object
8 writer 7665 non-null object
9 star 7667 non-null object
10 country 7665 non-null object
11 budget 5497 non-null float64
12 gross 7479 non-null float64
13 company 7651 non-null object
14 runtime 7664 non-null float64
dtypes: float64(5), int64(1), object(9)As seen, movies_data.info() gives a quick overview of our dataset. We can see that there are 7668 entries (rows) and a total of 15 columns.
movies_data.duplicated()#output
0 False
1 False
2 False
3 False
4 False
...
7663 False
7664 False
7665 False
7666 False
7667 False
Length: 7668, dtype: boolThe method movies_data.duplicated() checks if there are any duplicates. All rows returned False which means there are no duplicates.
movies_data.count()#output
name 7668
rating 7591
genre 7668
year 7668
released 7666
score 7665
votes 7665
director 7668
writer 7665
star 7667
country 7665
budget 5497
gross 7479
company 7651
runtime 7664Calling the count() method on the dataframe: movies_data.count() returns the sum of all entries in a column. Columns with less than 7668 entries suggest missing values.
movies_data.dropna()We dropped all columns with missing data using movies_data.dropna(). The output is a new dataframe. Next, we’ll create a Matplotlib bar chart that shows the average movie budget of movies in different genres.
st.write("""
Average Movie Budget, Grouped by Genre
""")
avg_budget = movies_data.groupby('genre')['budget'].mean().round()
avg_budget = avg_budget.reset_index()
genre = avg_budget['genre']
avg_bud = avg_budget['budget']
The groupby method groups data by categories using the columns of a dataset and applies a function to it. Here we group by the ‘genre’ and the ‘budget’. And we apply the mean() and the round() functions. The mean() function returns the average of a list of numbers while the round() function rounds up digits and returns a float. The reset_index() method resets the index of an updated dataframe; creating a new row index that starts at 0. Resetting indexes is important so pandas can find the indexes of elements.
fig = plt.figure(figsize = (19, 10))

plt.bar(genre, avg_bud, color = 'maroon')
plt.xlabel('genre')
plt.ylabel('budget')
plt.title('Matplotlib Bar Chart Showing the Average \
Budget of Movies in Each Genre')
Matplotlib has a function called show() that creates a figure object. In Streamlit, this line should be replaced with st.pyplot(variable_name) where variable_name is the variable of visualization.
st.pyplot(fig)
Layouts in Streamlit
How the dashboards are structured determines how well they’ll be received by all stakeholders. When a dashboard is messy, it confuses the users.
Streamlit offers a couple of options to lay out elements on a screen. Columns are the most common, but there are other containers like tabs, expanders, and sidebars. For this tutorial, we will focus on columns and sidebars.
Columns
Columns in Streamlit operate just as they do in documents and on web pages. They are also highly responsive and automatically resize on different screens.
To create columns, simply assign them to the variables that match the number of columns you need. Here, col1 and col2 are the variable names because we need two columns.
col1, col2 = st.columns(2)
col1.write('# This is Column 1')
col2.write('# This is Column 2')
We can as well create columns of different dimensions, where columns are of different sizes.
st.write('### Columns of different sizes')
col1, col2, col3, col4 = st.columns([1,3,1,2])

col1.write('# This is Column 1')
col2.write('# This is Column 2')
col3.write('# This is Column 3')
col4.write('# This is Column 4')
Working With Widgets
What Are Widgets?
Widgets are the elements that allow us to interact with data. Streamlit offers different widgets like sidebars, sliders, multiselect, text_input, radio button, and checkbox. Each widget has a different use case.
Why Are Widgets Important?
Widgets are important to interact with the rendered plots and charts. Before starting out, determine which widgets will be best for the project. A couple of steps are needed to make a widget interactive. We’ll look at them as we create widgets.
Here’s an overview of widgets used in this tutorial:
Slider: A slider is a widget that accepts numerical, date, or time data as input. It changes information according to the range of values selected.
Multiselect: Multiselect accepts strings and creates multiple selections of labels containing selected options. The default is a blank label so it should be assigned a default value.
Selectbox: Selectbox displays a select widget with options in a drop-down format.
Sidebar: A sidebar creates a sidebar at the left side of the page where other widgets, text, and even plots can reside. It is a very easy way to manage space on the web app .
To link data to a widget, we first convert the needed column to a unique list. This is important so only unique values are selected:
# Creating sidebar widget unique values from our movies dataset
score_rating = movies_data['score'].unique().tolist()
genre_list = movies_data['genre'].unique().tolist()
year_list = movies_data['year'].unique().tolist()
Creating a Sidebar and Adding Other Widgets
Create Layouts Using with Statements
The with statement provides a simpler, more organized way of displaying Streamlit layouts especially if multiple widgets or variables are attached to a layout component. Using with makes the code easier to maintain.
We use the with statement to group all elements of a layout together. We’ve implemented it with a sidebar layout, as shown:
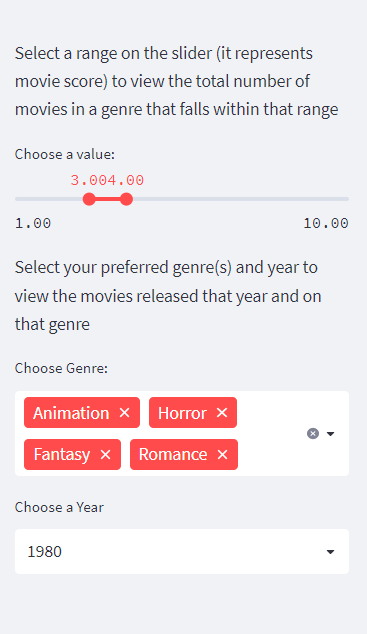
with st.sidebar:
       st.write("Select a range on the slider (it represents movie score) \
       to view the total number of movies in a genre that falls \
       within that range ")
    #create a slider to hold user scores
    new_score_rating = st.slider(label = "Choose a value:",
                                  min_value = 1.0,
                                  max_value = 10.0,
                                 value = (3.0,4.0))

#create a multiselect widget to display genre
new_genre_list = st.multiselect('Choose Genre:',
                                        genre_list, default = ['Animation',\
                                         'Horror',  'Fantasy', 'Romance'])
#create a selectbox option that holds all unique years
year = st.selectbox('Choose a Year',
    year_list, 0)
st.sidebar() is the function to call a sidebar widget. Once this is specified, the sidebar is automatically created. Our sidebar will hold different widgets so we use it in the with statement. st.slider is the function that creates a slider widget. It takes in parameters like label, min_value, max_value, and a value. The min_value is the specified minimum value. The max_value is the specified maximum value. The value is the point where it is rendered. st.multiselect() is the function that creates a multiselect widget. From our tutorial, we created a multiselect widget that displays all unique genres from the ‘genre’ column. We pre-selected ‘Animation’, ‘Horror’, ‘Fantasy’ and ‘Romance’ genres. While interacting with this widget, users can select or deselect as many options as they wish. A selectbox is created by calling the st.selectbox() function. The selectbox represents a drop-down menu that allows only one option to be picked at a time. We linked the ‘year’ column to this widget, so we can only pick one year at a time.

To add interactivity among the slider, the selectbox, the multiselect widgets, and the plots on the main page, we need to create filters. We do this by mapping the columns of the dataframe to their unique list and using it in the analysis. By doing so, we can ensure that only the selected widgets affect a plot.
#Configure and filter the slider widget for interactivity
score_info = (movies_data['score'].between(*new_score_rating))
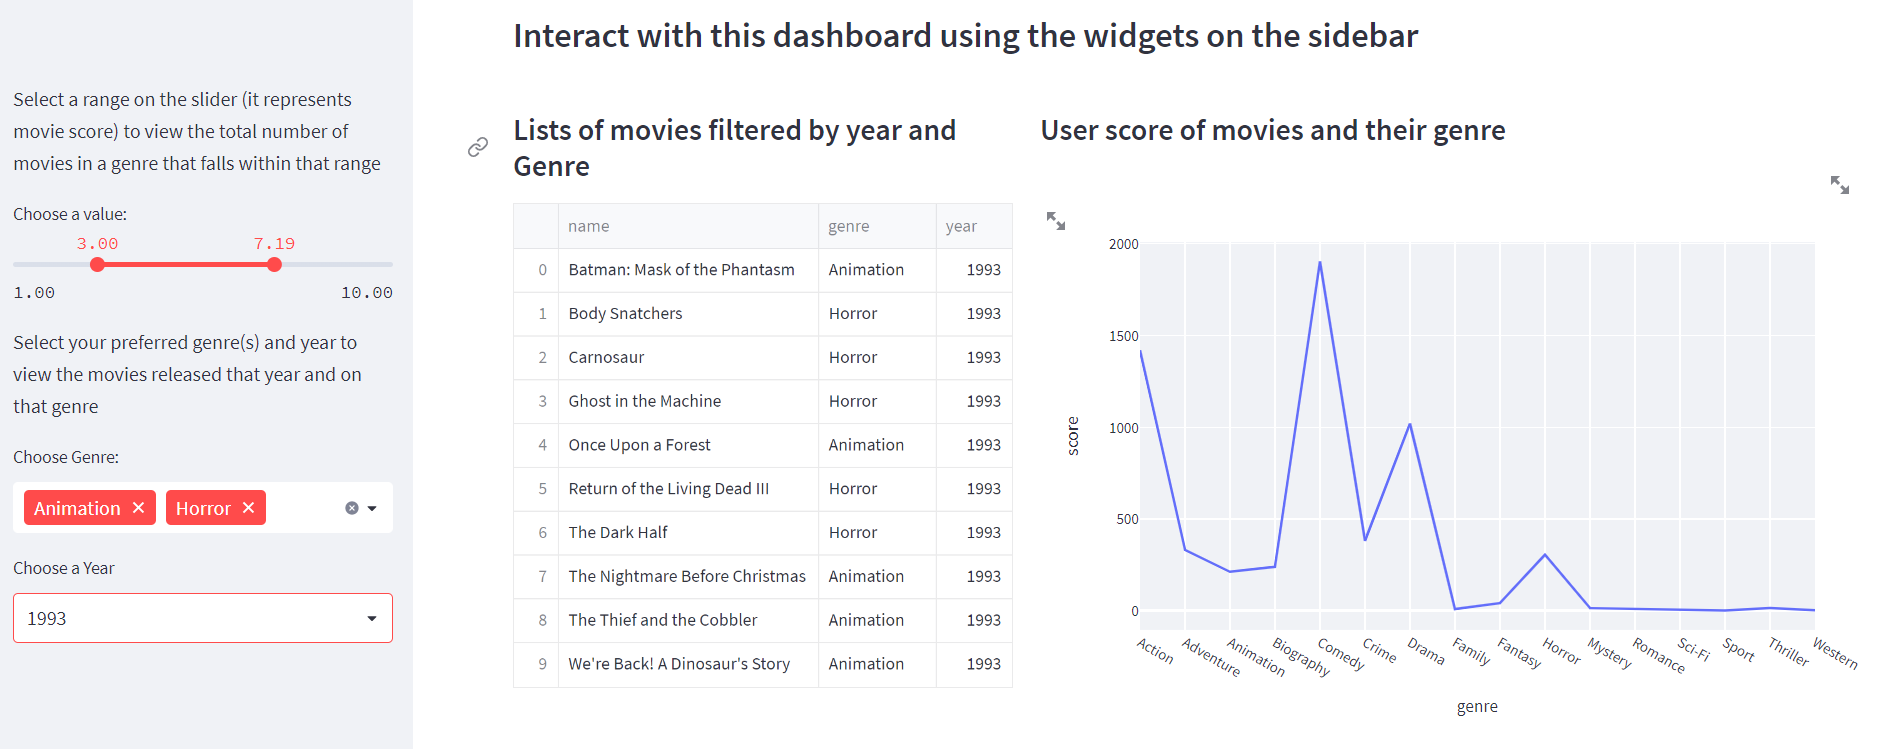
We will be linking the slider widget to the line chart that displays the number of movies in a particular genre that have scores that fall within a specified range. We mapped the ‘score’ column to the slider widget. Therefore, whenever a user interacts with the slider, the line chart changes as well.
#Filter the selectbox and multiselect widget for interactivity
new_genre_year = (movies_data['genre'].isin(new_genre_list)) \
& (movies_data['year'] == year)
We need the multiselect widget and the selectbox that holds genre and year to work together. We will be creating a dataframe that changes movie titles according to the year and genre(s) selected. In our configuration, we mapped the ‘genre’ column to the variable of our multiselect widget and mapped the ‘year’ column to the variable of our selectbox widget and joined them both using ‘and’.
# visualization section
#group the columns needed for visualizations
col1, col2 = st.columns([2,3])
with col1:
    st.write("""#### Lists of movies filtered by year and Genre """)
    dataframe_genre_year = movies_data[new_genre_year]\
    .groupby(['name',  'genre'])['year'].sum()
    dataframe_genre_year = dataframe_genre_year.reset_index()
    st.dataframe(dataframe_genre_year, width = 400)

with col2:
    st.write("""#### User score of movies and their genre """)
    rating_count_year = movies_data[score_info]\
    .groupby('genre')['score'].count()
    rating_count_year = rating_count_year.reset_index()
    figpx = px.line(rating_count_year, x = 'genre', y = 'score')
    st.plotly_chart(figpx)
Conclusion
Look at you, you’ve just aced the basics of Streamlit and discovered how to crank up your data visualization with interactive Plotly charts. Why not take it a step further and design a data dashboard with your favorite dataset? Go on, give it a shot!
And if you’re building data apps with Streamlit, consider boosting your build process with Earthly. It’s a tool that could significantly enhance your development workflow.
Earthly Lunar: Monitoring for your SDLC
Achieve Engineering Excellence with universal SDLC monitoring that works with every tech stack, microservice, and CI pipeline.


