Getting Started with AWS CloudWatch

Table of Contents
In today’s cloud-dominated digital landscape, the ability to monitor and track the performance of your applications is paramount. For those working with the Amazon Web Services (AWS) Cloud, AWS CloudWatch is a comprehensive monitoring and observability service designed to meet this critical need. This article will serve as a practical guide for those looking to familiarize themselves with CloudWatch and harness its powerful capabilities to enhance the reliability and efficiency of their applications.
You’ll notice that almost every service emits valuable performance metrics in AWS CloudWatch, such as latency and CPU utilization. Metrics are the fundamental building blocks of CloudWatch; with them, you can create alarms and dashboards to ensure continuous application monitoring. Additionally, CloudWatch Logs provide a steady stream of valuable application data. Together, these metrics and logs give you all the tools you need to monitor your application, and you must learn how to use them effectively. So, without further ado, dive in and see how you can use AWS CloudWatch to its fullest potential.
Setting Up CloudWatch

As you learn new CloudWatch concepts in this article, you should follow along in your AWS account, and accessing CloudWatch from the AWS Management Console is the first step. Once you log into the console, navigate to CloudWatch to get a feel for its intuitive web-based interface.
Most AWS services emit metrics and logs to AWS automatically (given the right permissions). Optionally, if you are working with Amazon Elastic Compute Cloud (Amazon EC2) instances and want those instances to send metrics and log data to CloudWatch, be sure to install the CloudWatch agent on them.
Finally, you can also install the AWS Software Development Kit (SDK) and Command Line Interface (CLI). These tools provide programmatic access to CloudWatch, allowing you to integrate CloudWatch with your applications and automate certain tasks.
Monitoring AWS Resources

To get started with AWS CloudWatch, there are three key concepts that you need to understand — metrics, namespaces, and dimensions:
- A metric is a set of data points that represents the behavior or performance of an AWS resource. For example, EC2 instances emit a metric called
CPUUtilization. Other metrics may include information about a resource’s error rates, latency, or network traffic. - A metric is associated with exactly one namespace. A namespace is a unique identifier for a group of related metrics. Most services use the namespace
AWS/<service>. For instance, EC2 metrics automatically use the namespaceAWS/EC2. - A metric is also associated with zero or more dimensions. A dimension is a name-value pair that provides additional context to a metric and allows you to filter and analyze metrics based on criteria. For example, for an EC2 instance, dimensions could include the instance ID, region, or instance type.
Predefined CloudWatch Metrics
To understand these concepts better, look at some predefined CloudWatch metrics. These are metrics that CloudWatch automatically collects. As long as you have a single active resource with a service, you can view and use these metrics from the CloudWatch console out of the box.
Explore a few predefined metrics for three extremely popular AWS resources: EC2 instances, Amazon Relational Database Service (Amazon RDS) databases, and Lambda functions.
EC2 Instance Metrics
Here are some key metrics that give insight into the performance and health of your EC2 instances (under AWS/EC2):
CPUUtilization: As was previously mentioned, this metric measures the percentage of CPU utilization for an EC2 instance over a specific period. This can help drive decisions on scaling and performance optimization.NetworkInandNetworkOut: These metrics track the amount of network traffic received and sent by your EC2 instance, respectively. You can use this metric to assess your instances’ network activity and data transfer rate.
RDS Database Metrics
Moving on to RDS metrics (under AWS/RDS), the following are some key metrics:
DatabaseConnections: This metric tracks the number of connections to your RDS database. This helps you track demand on your database and ensure it can efficiently handle the required number of connections.DatabaseThroughput: This metric represents the amount of data transferred to and from your RDS instance. This can help you identify peak usage periods and scale your database accordingly.
Lambda Function Metrics
Finally, see what key metrics Lambda has to offer (under AWS/Lambda):
Invocations: This metric tracks the number of times your Lambda function is invoked. This helps you understand traffic patterns to your function.Throttles: This metric measures the number of times Lambda throttled your executions due to resource limitations. This can help you determine whether you need a concurrency limit increase or if other adjustments need to be made.
Other AWS Services
In general, when monitoring any AWS service, pay attention to the following classes of metrics:
Latency: Latency metrics track the time taken for processing requests. These are critical for services like Elastic Load Balancer (ELB) and Lambda. Monitoring latency can help you identify performance bottlenecks in your application.RequestCount: This metric is specific to API Gateway or Application Load Balancer (ALB) services. It represents the number of requests these services process, providing insights into traffic load and request patterns.ErrorRate: Error rate metrics indicate the rate of errors a service encounters. This can help you identify which part of your application is facing issues and troubleshoot them accordingly.
Custom Metrics
Need more than the metrics that AWS emits by default? With AWS CloudWatch, you can also emit custom metrics with just a few extra lines in your application code.
To see how powerful this can be, suppose you currently sell a product in three colors (red, yellow, and blue), and you have a Lambda function that handles incoming orders. If you wanted to keep track of how many units of each color you sell in CloudWatch, you might add the following lines into your Lambda function (you’re using Python here, but you can insert similar code in any language and in any application code that consumes the AWS SDK):
def lambda_handler(event, context):

    # application logic here

    cloudwatch = boto3.client('cloudwatch')
    color = event['color'] # String
    units_sold = event['units_sold'] # String

    cloudwatch.put_metric_data(
        MetricData=[
            {
                'MetricName': 'Units Sold By Color',
                'Dimensions': [
                    {
                        'Name': 'Color',
                        'Value': color
                    }
                ],
                'Value': int(units_sold),
                'Unit': 'None'
            }
        ],
        Namespace='Products'
    )

   # more application logic here
This code initializes a CloudWatch client, and then obtains two fields from the input event: the color of the unit sold, and the number of units_sold. To put custom metric data into CloudWatch, the code then calls the CloudWatch PutMetricData API with the color and units_sold parameters.
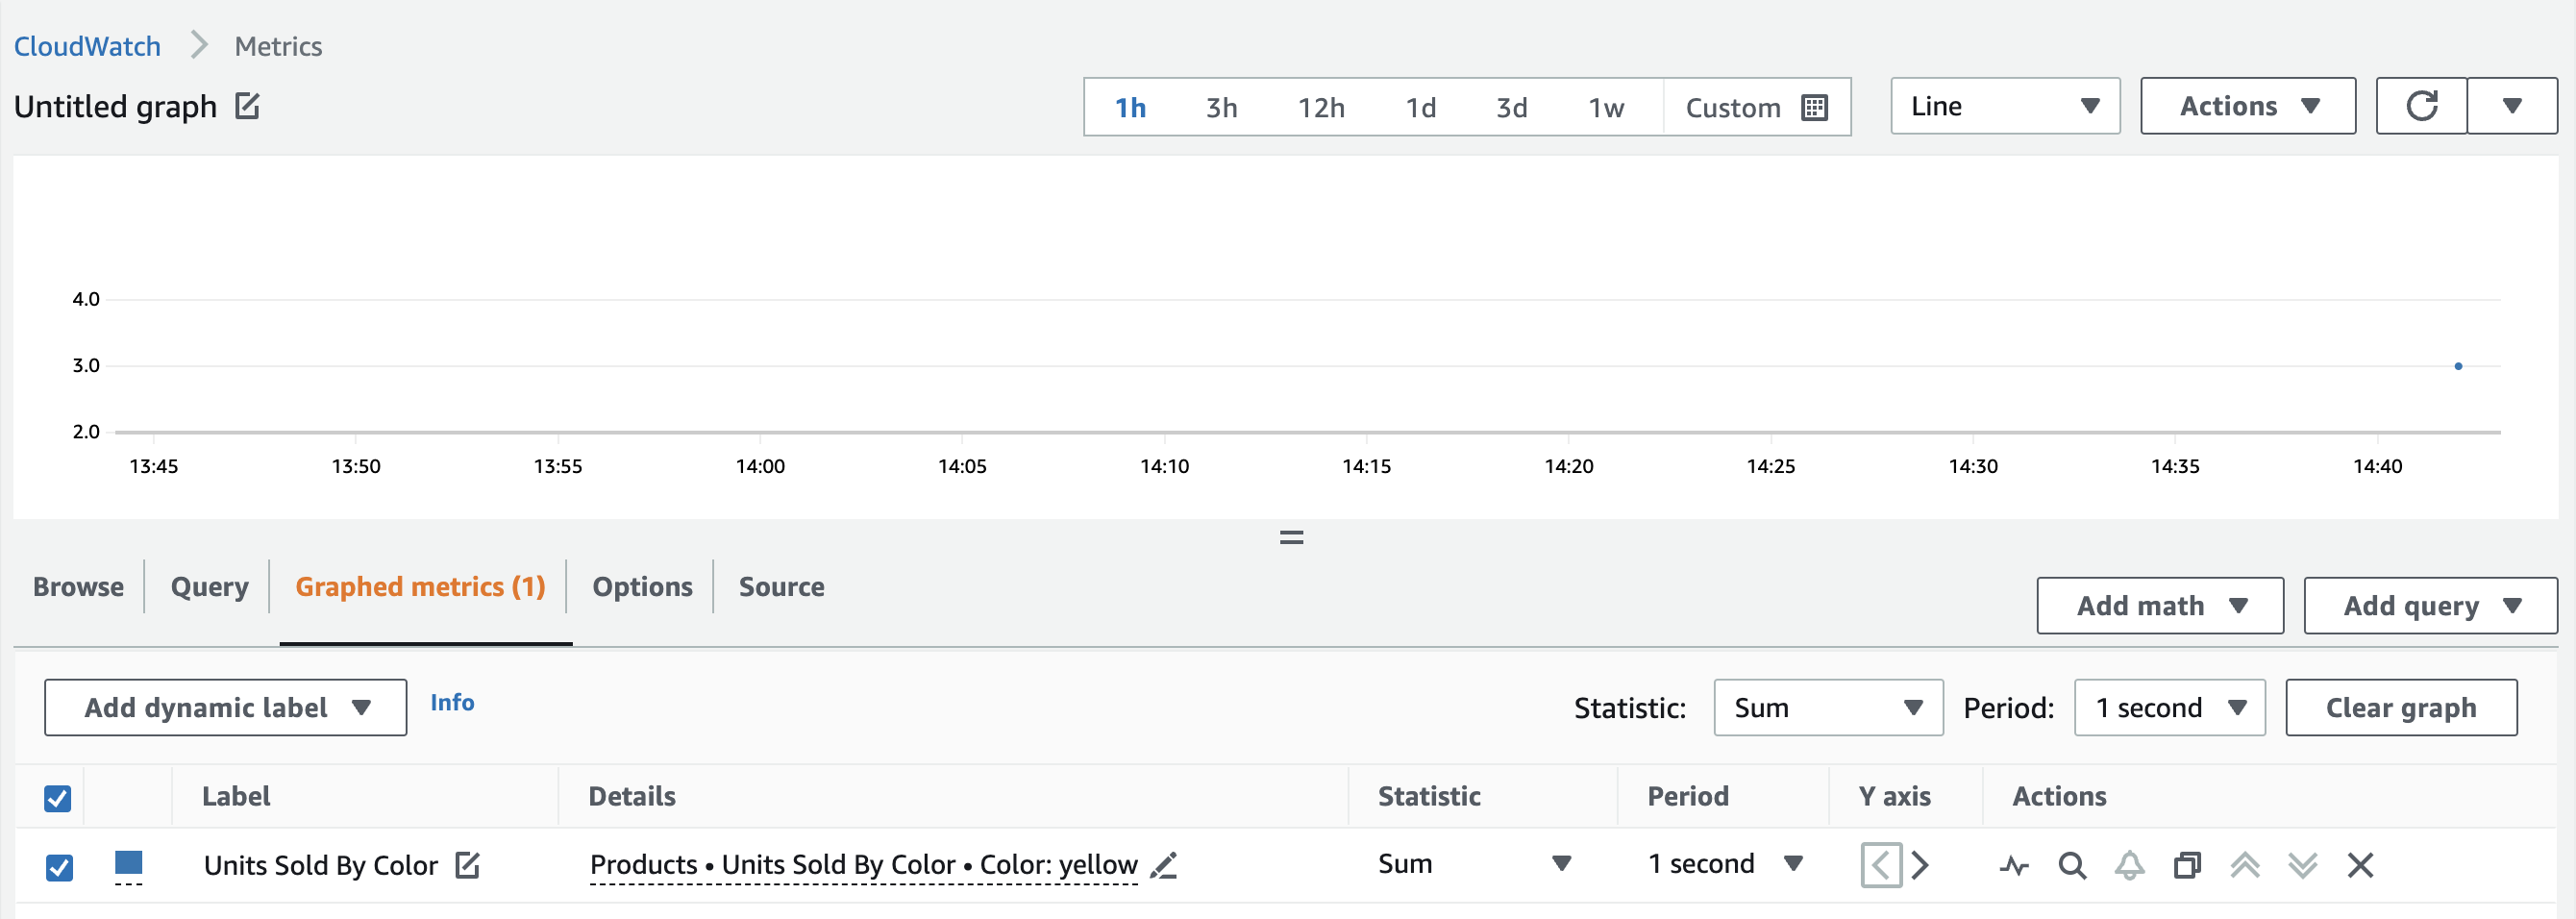
To test this function, you can invoke it with the following JSON event object (ie via the AWS Lambda console):
{
    "color": "yellow",
    "units_sold": "3"
}
You should see the metric show up in CloudWatch, under the custom Products namespace:
You can use custom metrics in many ways, including the following:
- Business and operational insights: You can use custom metrics to capture and analyze business data to gain insights into operations. For instance, you can track key performance indicators (KPIs), user engagement metrics, or revenue numbers.
- IoT device monitoring: Custom metrics are often used when working with IoT devices. In particular, you may want to track device-specific metrics, such as device health, sensor data, or connectivity status.
- Machine learning model performance: An interesting use case involves machine learning, where you might create metrics to monitor the prediction accuracy of your models.
Alarms and Notifications

Once you’ve set up metrics for your application, the next step is to set up CloudWatch alarms. Alarms allow you to automate actions based on custom thresholds and conditions. For instance, from the CloudWatch console, you can set up an alarm that sends a notification via Amazon SNS whenever your Lambda functions throttle more than five times in a minute:
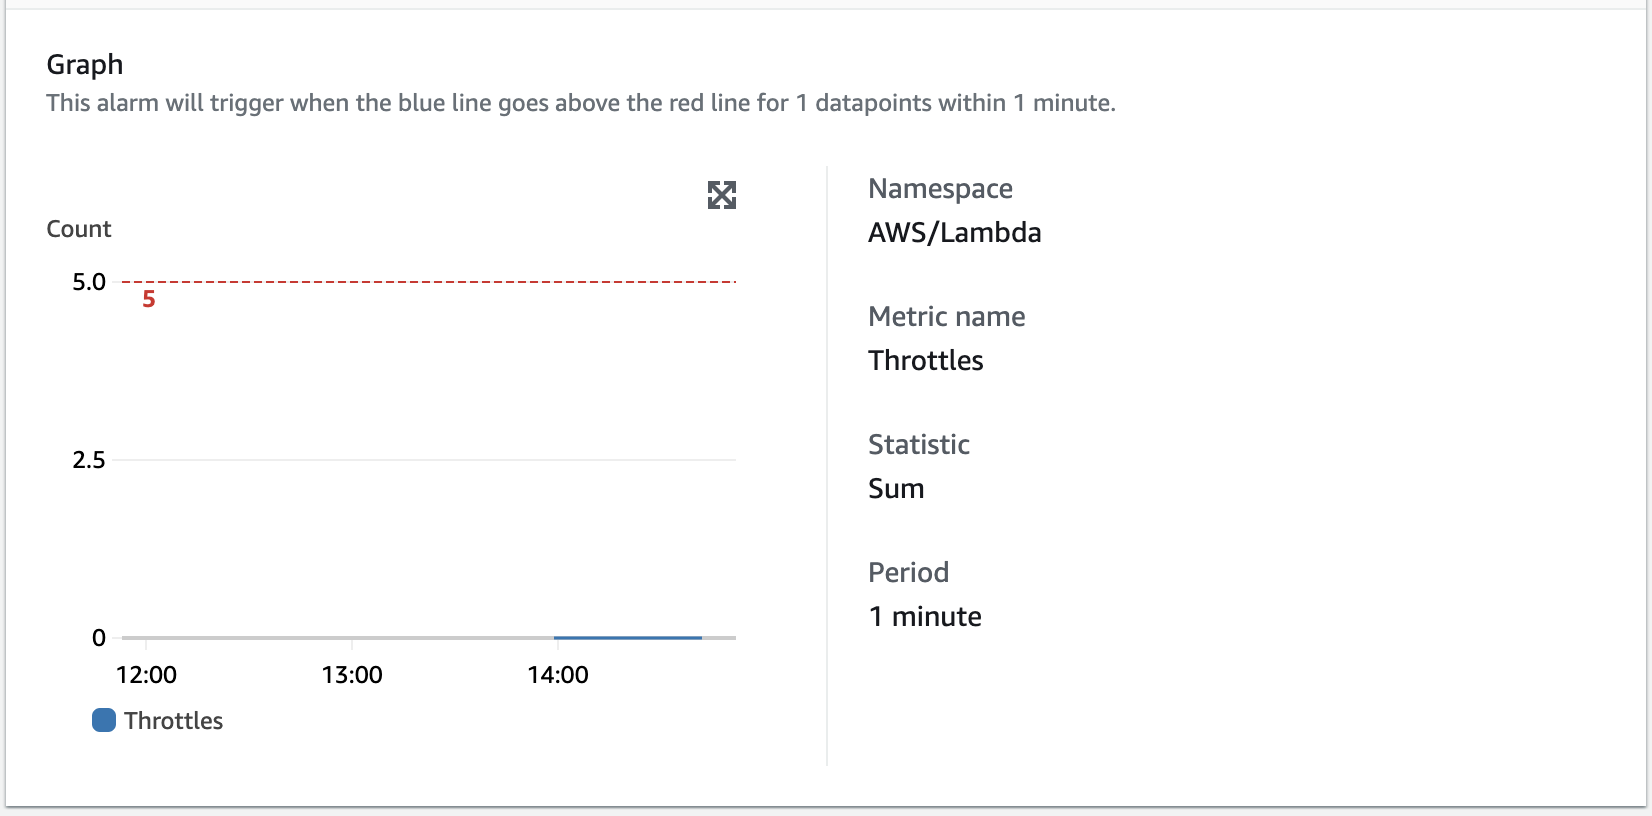
When setting up your alarm, note these configurations:
- Metric selection: Select the metric you want the alarm to track.
- Threshold configuration: Define a threshold value that triggers the alarm. In this example, you use a static value of
>5over one minute. - Evaluation period: Define the number of consecutive periods during which the threshold must be breached before triggering the alarm state. Here, you specified
1. A value of2would indicate that your function must breach the threshold for two consecutive one-minute periods for the alarm to trigger.
After your alarm is set up, there are three alarm states you should be aware of:
OK: The metric is within the defined threshold. No actions need to be taken.INSUFFICIENT_DATA: There’s not enough data to determine the state of the metric. This may occur when data is missing or has yet to be received.ALARM: The metric has breached the threshold. CloudWatch triggers the defined action.
CloudWatch Dashboards
Now that you have metrics and alarms, why not put them all into a centralized dashboard? In CloudWatch, you can create personalized, real-time views of select metrics and alarms. Dashboards can help you gain insights into the health and performance of your AWS resources at a glance.
The components of a CloudWatch dashboard are called widgets. There are a couple of common widgets, such as line charts, stacked area charts, single value, and alarm status. For example, you can create a quick dashboard using the custom metric Units Sold By Color (line chart) and the alarm you created (alarm status) in the previous two sections:
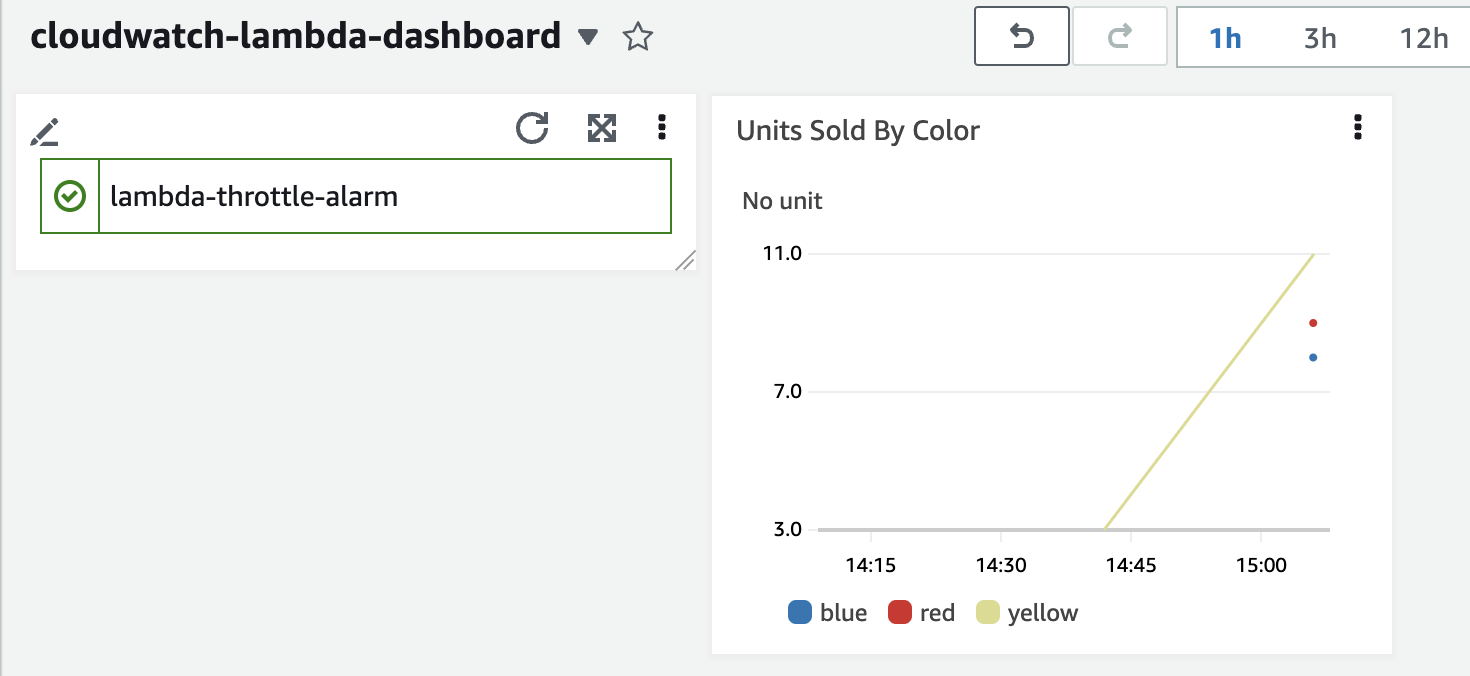
After creating a dashboard, you can share them with team members or stakeholders, allowing for collaborative analysis. A common workflow is sharing a dashboard snapshot to support troubleshooting or monitoring efforts. This generates a snapshot URL for your dashboard and grants specific users read-only access.
CloudWatch Logs and Log Insights
Finally, you have CloudWatch Logs, a fully managed service that offers storage and access to log files from various AWS services. It provides a central repository that makes collecting and analyzing logs easy, which is often critical for troubleshooting issues. CloudWatch Logs can streamline your log management since it’s already integrated with other AWS services.
Some key features of CloudWatch Logs include the following:
- Log storage and retention: CloudWatch Logs stores your log data securely and provides long-term retention options. You can choose retention periods ranging from a few days to indefinitely, depending on application and compliance requirements.
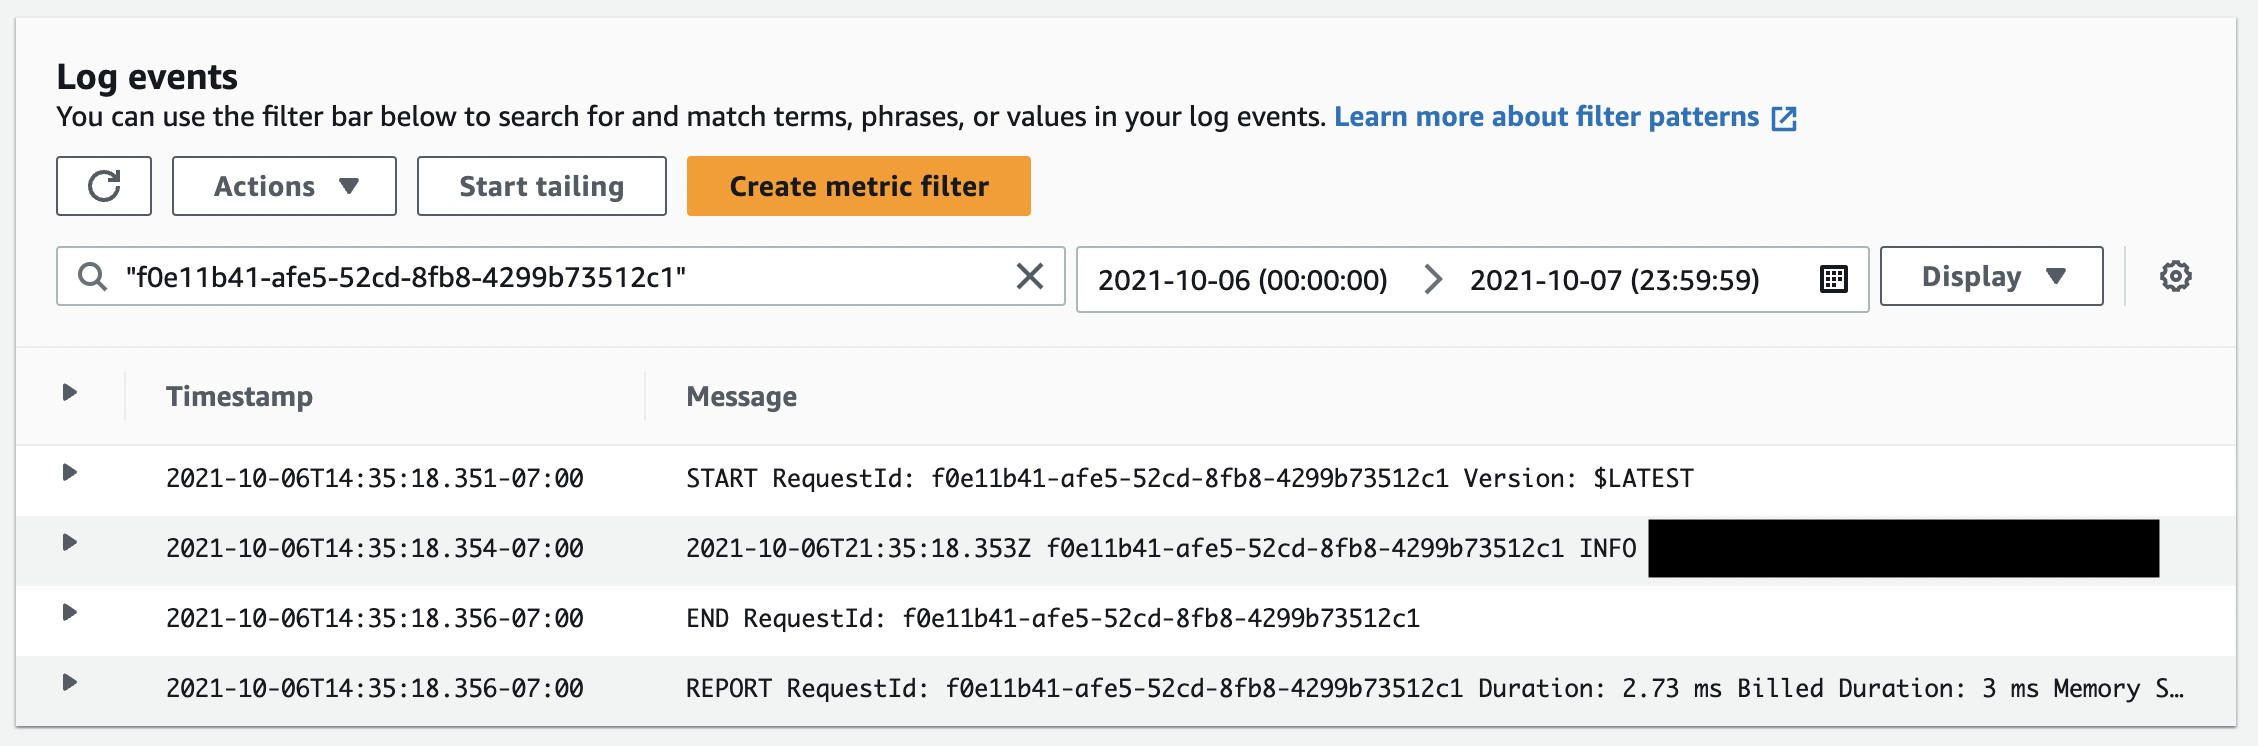
- Searching and filtering: Within a log group, you can filter and search for specific logs. From the console, you can enter simple text-based searches or filter expressions using CloudWatch Logs filter syntax. For example, you could filter on the request ID if you’re tracking logs for a specific request. The filtered logs are displayed in the console, and you can further refine the search criteria if you want.
- CloudWatch Log Insights: Log Insights is an extension of CloudWatch Logs that enables you to run advanced queries using a purpose-built query language. It automatically discovers fields from logs in AWS services such as
@timestampor@message, making it easy to write and execute queries on your log data. Log Insights leverage an optimized query engine to deliver fast results, making it ideal for large volumes of log data. You can also create custom visualizations from the results to gain deeper insights.
Conclusion
This article introduced AWS CloudWatch and some of its key concepts and features, including metrics, alarms, dashboards, and logs. In addition, you learned how to customize CloudWatch to fit your application needs by creating custom metrics and dashboards. This is all essential knowledge required for you to monitor and track the performance of your AWS applications effectively.
As you continue using AWS CloudWatch, be mindful of best practices, such as choosing the correct monitoring granularity, which varies from metric to metric. In addition, be sure to keep your alarms and dashboards organized (ie via CloudFormation) since they can get overwhelming to manage as you continue to add them. Finally, remember to choose an appropriate retention policy for your logs, which may depend on local laws and regulations.
A service like CloudWatch is also great to use alongside a build automation tool like Earthly, which helps developers create reproducible and efficient build procedures. While Earthly itself doesn’t directly integrate with CloudWatch, it can be used with Earthly features to help you monitor deployment-related metrics. For instance, you can use the monitored data to drive decisions on modifying Earthfiles and other continuous integration, continuous delivery (CI/CD) scripts that you use to automate deployments.
Turn your engineering standards into automated guardrails that provide feedback directly in pull requests, with 100+ guardrails included out of the box and support for the tools and CI/CD systems you already have.