Load Testing Backend Services Using K6

When it comes to software applications, ensuring your app works as expected is not enough. Users generally expect applications to work 24/7 – with minimal downtime – and especially when there’s high traffic, say, during Black Friday sales. This is why implementing a load test for your application is crucial.
Tools such as Jmeter, Gatling, or Load runner help to implement load tests for application services. These tools provide great features that support load testing, like simulating user requests or collecting test runner logs to show whether the service works as expected. However, scaling many requests and monitoring the test runner efficiently using these tools is complicated. This is where a tool like k6 can help.
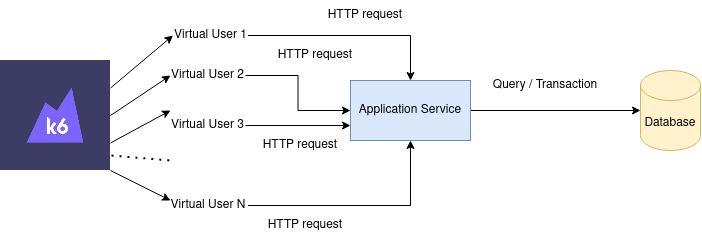
With k6, you can easily scale out the expected users’ requests you need and be able to visualize the status of your load test using several reporter tools like InfluxDB, Prometheus, or Grafana. In this article, you will learn how to implement a load test for a blog management service using k6 and create a visualization report for the load test result using InfluxDB and Grafana.
What Is a Load Test?
A load test is one form of performance testing implemented to ensure your application works properly under an expected number of users’ requests. Let’s say you have a shopping application that allows users to buy clothes. On the launching day, you expect about one thousand customers to sign up for new accounts on the app every minute. To ensure the application can handle these user requests, you must write tests that simulate one thousand users signing up to the app every minute. These tests are called load tests.
What Is K6?
k6 is a performance test tool to check if your application services work as expected. K6 provides several plugins, allowing you to integrate k6 into your existing tech stack easily.
It is built from the ground up using Go programming language, which allows the test to scale up easily to meet the expected generated user requests. To implement the test in k6, you write the test scenarios using Javascript to format the code and reuse the block of code later without learning the Go programming language.
k6 helps you to perform different types of load testing such as spike testing, smoke testing, or soak testing by customizing the test scenarios. You can also perform load testing for front-end services using the k6 browser module.
Besides the default report showing in the console after the test execution is done, you can export the test metrics to other services like InfluxDB, or Apache Kafka so that you can view the report visually in real-time during the test execution.
Prerequisites
To follow along with this article, please prepare the following prerequisites:
- A Linux-based machine (preferably an Ubuntu machine version 20.04 since this article demonstration is tested on it)
- A ready-to-use Python environment version from 3.7 to above since you will use FastAPI to implement the backend service and FastAPI only supports Python from version 3.7
- A ready-to-use MySQL database server to store the backend service data
Demonstration
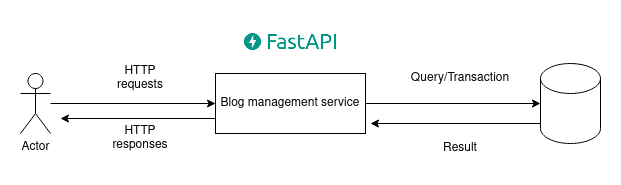
You will first create an example backend service, then implement a load test for that service using k6. The backend service will have features that support users in managing their blog posts.
You will build the backend service using the FastAPI framework with Python. FastAPI is a popular web framework that provides decent web performance and features support integrating well with databases or third-party dependencies.
To store the database for the backend service, you will use MySQL database.
The steps for building the backend service will be as below:
Clone the GitHub repository which contains the implementation code for building the backend service.
Install the dependencies listed in
requirements.txtfile in the cloned code directory so that you can run the service later.Create a MySQL database and the tables named
user_infoandbloginside it since the blog service needs these tables to store the user data.Run the service.
You will load test the built backend service using k6. By default, k6 supports test reports through the console. However, it would be helpful to store the test reports for later reference and be able to view the report metrics in real time while the test is running. Integrating InfluxDB and Grafana with k6 will help you to visualize the load test metrics instantly.
Below are the steps to implement the load test for the backend service:
- Install k6 to run the load test.
- Implement load tests using Javascript to define the test scenarios.
- Run the load test.
- Integrate k6 with InfluxDB and Grafana to store the test metrics in InfluxDB and view them through the Grafana dashboard
- Visualize the test metrics by using the pre-built Grafana template for k6 and InfluxDB.
Step 1: Clone the Github Repo
The complete code is stored on this GitHub repository. You need to clone the code to your local environment to run the service and execute the test.
Open your terminal, run the following command to create a new directory called Projects, and clone the code to that directory.
mkdir ~/Projects
cd ~/Projects
git clone git@github.com:cuongld2/earthly-k6-load-test-service.git
cd earthly-k6-load-test-service
You should have the following directories and files in your current earthly-k6-load-test-service folder.
├── app_utils.py
├── crud.py
├── database.py
├── main.py
├── models.py
├── requirements.txt
├── schemas.py
├── script.js
You now have the code for the backend service and the load test. The load test implementation is stored in script.js file. You will skip that for now since you will learn more about it in “Step 6: Write the sample load test using k6”.
All the other files except for script.js are for building the backend service.
requirements.txtfile: stores the dependencies you must rely on to build the backend service.app_utils.py: stores the small utility functions to create a user access token when the user calls the authentication API and decodes it in APIs for interacting with the blog.crud.py: defines the functions for every API like creating a new user, authenticating a user, or creating a new blog.database.py: is used for connecting to the MySQL database using the database credentials.models.py: defines the table models of the MySQL database that the service will interact with.schemas.py: defines the data models for the blog APIs’ request body and response body.main.py: is the application’s entry point which defines all the routes of the APIs.
The next step would be installing the project dependencies to run the blog management service.
Step 2: Install Needed Dependencies
You will initiate a virtual environment for the Python project first so that the dependencies that are about to install in the current project do not conflict with the same dependencies in another project within your same machine.
There are several tools for creating Python virtual environments, such as venv, poetry, Pyenv. Let’s use venv for simplicity. By default, you have the built-in venv with Python since version 3.3.
To initialize a Python virtualenv in the current directory, run the following command:
python3 -m venvYou may need to install the below additional package if you get an error message stating ensurepip is not available.
sudo apt install python3.10-venvThen activate the virtual environment by running the following command:
source bin/activateAll the dependencies are listed in requirements.txt file, to install the dependencies, run the command below:
pip install -r requirements.txtInside the requirements.txt file you can see the listed dependencies as follow:
asgiref==3.4.1
atomicwrites==1.4.0
attrs==21.2.0
bcrypt==3.2.0
cffi==1.14.6
click==8.0.1
colorama==0.4.4
cryptography==3.4.8
fastapi==0.68.1
greenlet==1.1.1
h11==0.12.0
iniconfig==1.1.1
mysql-connector-python==8.0.26
packaging==21.0
pluggy==1.0.0
protobuf==3.17.3
py==1.10.0
pycparser==2.20
pydantic==1.8.2
PyJWT==2.1.0
pyparsing==2.4.7
pytest==6.2.5
six==1.16.0
SQLAlchemy==1.4.23
starlette==0.14.2
toml==0.10.2
typing-extensions==3.10.0.2
uvicorn==0.15.0
There are a lot of dependencies here but you should pay attention to the following:
fastapidependency provides functionalities to build the API routes and connect to other components of the blogging servicemysql-connector-pythondependency is for allowing the service to connect to the MySQL database.uvicorndependency is for bringing up the web server.
Now that you successfully installed all the needed dependencies, let’s move on to create a MySQL database to store the data for the blog application.
Step 3: Create a MySQL Database
You need to access the MySQL database as the root account to create a new database and to create a new user later on. To access the MySQL database as a root account, run the following command:
sudo mysqlThen run the following command to create a new database called blogFastAPI.
CREATE DATABASE blogFastAPI;Then create a new MySQL user. As a best practice, you should not use the root user to access the database but only a user with minimum permissions.
Create a user in MySQL database:
CREATE USER 'your_user'@'localhost' IDENTIFIED BY 'your_password';Then add permissions for the user to modify the blogFastAPI database:
GRANT ALL PRIVILEGES ON blogFastAPI.* TO 'your_user'@'localhost';Now exit the current session in the MySQL database, then try to access the MySQL database named blogFastAPI using the new MySQL user.
exit
mysql -h localhost -p blogFastAPI -u your_user
MySQL will ask you to provide your user password, do so, then you should successfully access the MySQL database.
Run the following command to use the blogFastAPI:
use blogFastAPIThen create two tables user_info and blog to store the User information and Blog data for the application. To do so, run the following command:
CREATE TABLE blog (
  id INT(6) UNSIGNED AUTO_INCREMENT PRIMARY KEY,
  title VARCHAR(500) NOT NULL,
  content VARCHAR(5000) NOT NULL
);


CREATE TABLE user_info(
  id INT(6) UNSIGNED AUTO_INCREMENT PRIMARY KEY,
  username VARCHAR(50) NOT NULL,
  password VARCHAR(500) NOT NULL,
  fullname VARCHAR(50) NOT NULL
);
You have now successfully created the database blogFastAPI and the user has access to the database. Let’s move on to bring up the blog app.
Step 4: Run the App
Navigate back to the terminal that is currently inside the root project directory of the app. Inside the file database.py, you have the codes to help the blog service access the MySQL database.
USER = os.getenv('DB_USER')
PASSWORD = os.getenv('DB_PASSWORD')

SQLALCHEMY_DATABASE_URL = (f"mysql+mysqlconnector://{USER}:{PASSWORD}[@localhost:3306/blogFastAPI")](https://github.com/localhost:3306/blogFastAPI"))
SQLAlchemy is a Python library which helps the application to connect to several databases, including MySQL database. For SQLAlchemy to connect to MySQL Database, you need to provide the MySQL database URL.
The value of MySQL database URL is stored in the SQLALCHEMY_DATABASE_URL variable. In SQLALCHEMY_DATABASE_URL` variable, you need to provide the following information:
DB_USERandDB_PASSWORDwhich are the username and password of the user who has permission to access the MySQL database.localhost, the hostname of the database.- The port number of the database, the current value is
3306. - The name of the database, the current value is
blogFastAPI.
Now you need to create environment variables for DB_USER and DB_PASSWORD for your app to access the MySQL database.
export DB_USER=your_user
export DB_PASSWORD=your_password
To run the FastAPI service, you need to choose the web server for the FastAPI first. FastAPI uses ASGI server (Asynchronous Server Gateway Interface server) to deploy its application. There are several options for the ASGI server that you can use with FastAPI such as Uvicorn, Hypercorn, Daphne.
In this article, you will use the uvicorn server to bring up the backend service.
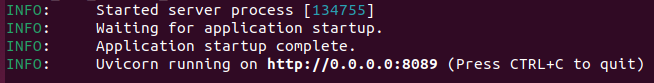
Executing the below command will tell uvicorn to look for the entry point of the application in the main.py file and bring up the service at localhost (0.0.0.0) with the port number 8089.
uvicorn main:app --host 0.0.0.0 --port 8089Your application should run on port 8089 on the local machine now.
Let’s move on to install k6 to implement the application’s load tests.
Step 5: Install K6
You can install k6 directly to your Ubuntu machine or using Docker. Let’s go with option one. Open up a new terminal and run the following commands:
sudo gpg --no-default-keyring \
--keyring /usr/share/keyrings/k6-archive-keyring.gpg \
--keyserver hkp://keyserver.ubuntu.com:80 --recv-keys \
C5AD17C747E3415A3642D57D77C6C491D6AC1D69
echo "deb [signed-by=/usr/share/keyrings/k6-archive-keyring.gpg] \
https://dl.k6.io/deb stable main" | sudo tee /etc/apt/sources.list.d/k6.list
sudo apt-get update
sudo apt-get install k6
If you encounter the error similar to the below message:
gpg: failed to create temporary file\
'/root/.gnupg/.#lk0x0000557727b67100.donaldle-HP-ProBook-440-G7.15824': \
No such file or directory
gpg: connecting dirmngr at '/root/.gnupg/S.dirmngr' failed: \
No such file or directory
gpg: keyserver receive failed: No dirmngr
You need to login the root session and create a directory named .gnupg inside root directory.
sudo -i
cd /root
mkdir .gnupg
Then run the installing steps for k6 again.
After successfully installing k6, let’s move on to write the load test using k6
Step 6: Write the Sample Load Test Using K6
Open up another terminal inside the root directory of the app, then run the below command to view the script for implementing load tests.
cat script.jsTo interact with the blog app and check the status code from the blog APIs, you need to import the k6 http library to create the HTTP request and check function to verify the status code of the APIs.
import http from 'k6/http';
import {check } from 'k6';
To define the test scenario for the load test, you need to include the scenario inside the export const options code block. You can define the test scenario to ramp up the virtual user count slowly, or generate all of the users at once by using different values for duration and target parameters.
export const options = {

    vus: 10,
    stages:[
        {duration: '5s', target: 1},
        {duration: '10s', target: 10},
        {duration: '5s', target: 0}
    ],

  };
Currently, you are setting up the load test scenario to have 10 virtual users by defining vus:10. The user will be generated gradually in each stage. In the first 5 seconds, there’s only one virtual user, {duration: '5s', target: 1}. Then within the next 10 seconds, the generated users will reach 10, {duration: '10s', target: 10}. Then finally you remove the users from 10 users to 0 users in the next 5 seconds, {duration: '5s', target: 0}.
Moving on to the next block of code, you have the defined function inside the export default function code block that tells k6 what each virtual user will do in each process. First, the virtual user will need to grab the access token using the authentication API.
const responseAuthen = http.post(serviceBaseUrl+'/authenticate',\
JSON.stringify({
        username: "earthly",
        password: "12345"
    }),{headers: { 'Content-Type': 'application/json' }})

const authenToken = responseAuthen.json().access_token
Then, the user will use that token to access the creating blog API to create a new blog with the request body containing title, content, and the author of the new blog.
const authenToken = responseAuthen.json().access_token

const params = {
        headers: { 'Authorization': 'Bearer ' + authenToken },
          };

const responseCreateNewBlog = http.post(serviceBaseUrl+'/blog',\
JSON.stringify({
        title:"Blog for Earthly",
        content:"Blog for Earthly",
        author:"Donald Le"
    }),params)
Then you will check the status code of the APIs for authenticating user credentials and creating a new blog. You expect these APIs should show successful results by verifying the status code value should equal 200.
check(responseAuthen, { 'status was 200': (r) => r.status == 200 });
check(responseCreateNewBlog, { 'status was 200': (r) => r.status == 200 });
You just went through the code implementation for the load test. Let’s move on to the next step to see how you can run the test.
Step 7: Run the Load Test
Before running the k6 test, you must create a user for the blog app first, to have the access token to create a new blog. Run the following command to do so:
curl --location 'http://localhost:8089/user' \
--header 'Content-Type: application/json' \
--data '{
    "username": "earthly",
    "password": "12345",
    "fullname": "Earthly aloha"
}'
To run the k6 test, execute the following command:
k6 run script.jsNow that the test has been successfully executed, let’s move on to integrate k6 with InfluxDB and Grafana so that you can easily see the test report metrics while your load test is running.
Step 8: Integrate k6 With InfluxDB and Grafana
You will use InfluxDB to store the test metrics and use Grafana for visualizing the metrics. Run the following command to install InfluxDB:
sudo apt install influxdbTo install Grafana, run the following command:
sudo snap install grafanaNow, rerun the test execution for k6 load testing, but this time you provide an option to send the test metrics to InfluxDB database.
k6 run --out influxdb=http://localhost:8086/getStartedK6 script.jsAfter the test execution finishes, the metrics will be sent to a new database named getStartedK6 in InfluxDB.
You have now successfully integrated the K6 test with InfluxDB and Grafana, let’s move on to visualize the load test metrics in Grafana.
Step 9: Visualize Load Test Metrics in Grafana
To visualize load test metrics in Grafana, you need to configure the InfluxDB database and create a dashboard in Grafana.
Configure InfluxDB Database in Grafana
From your browser, open the URL: http://localhost:3000 to access Grafana. By default, the username and password of the admin are admin/admin. You should change them immediately after you log in.
After logging in, click on “Configurations” on the left side panel of the Grafana page, and choose “Data sources” to configure the InfluxDB data source.

Then click on “Add data source” to add a new data source.

Click on “InfluxDB” option and configure your InfluxDB data source as below (Ignore the password input since we do not set a password for the “getStartedK6” database so we don’t need to provide a password to access the database):
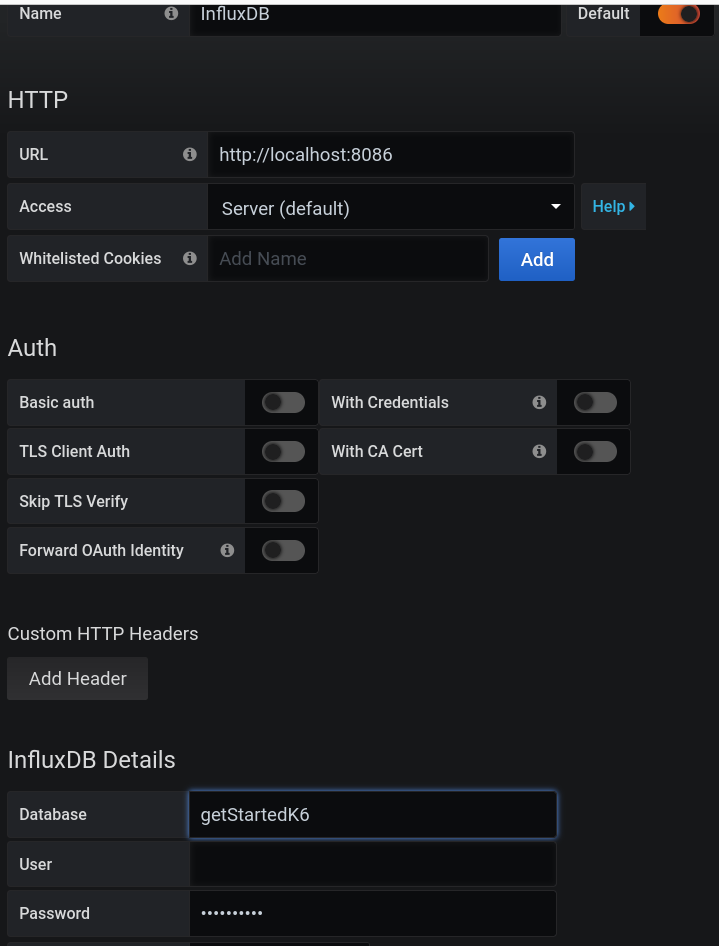
Click the “Save & Test” button, and you should successfully connect to the InfluxDB database.
Create a Grafana Dashboard
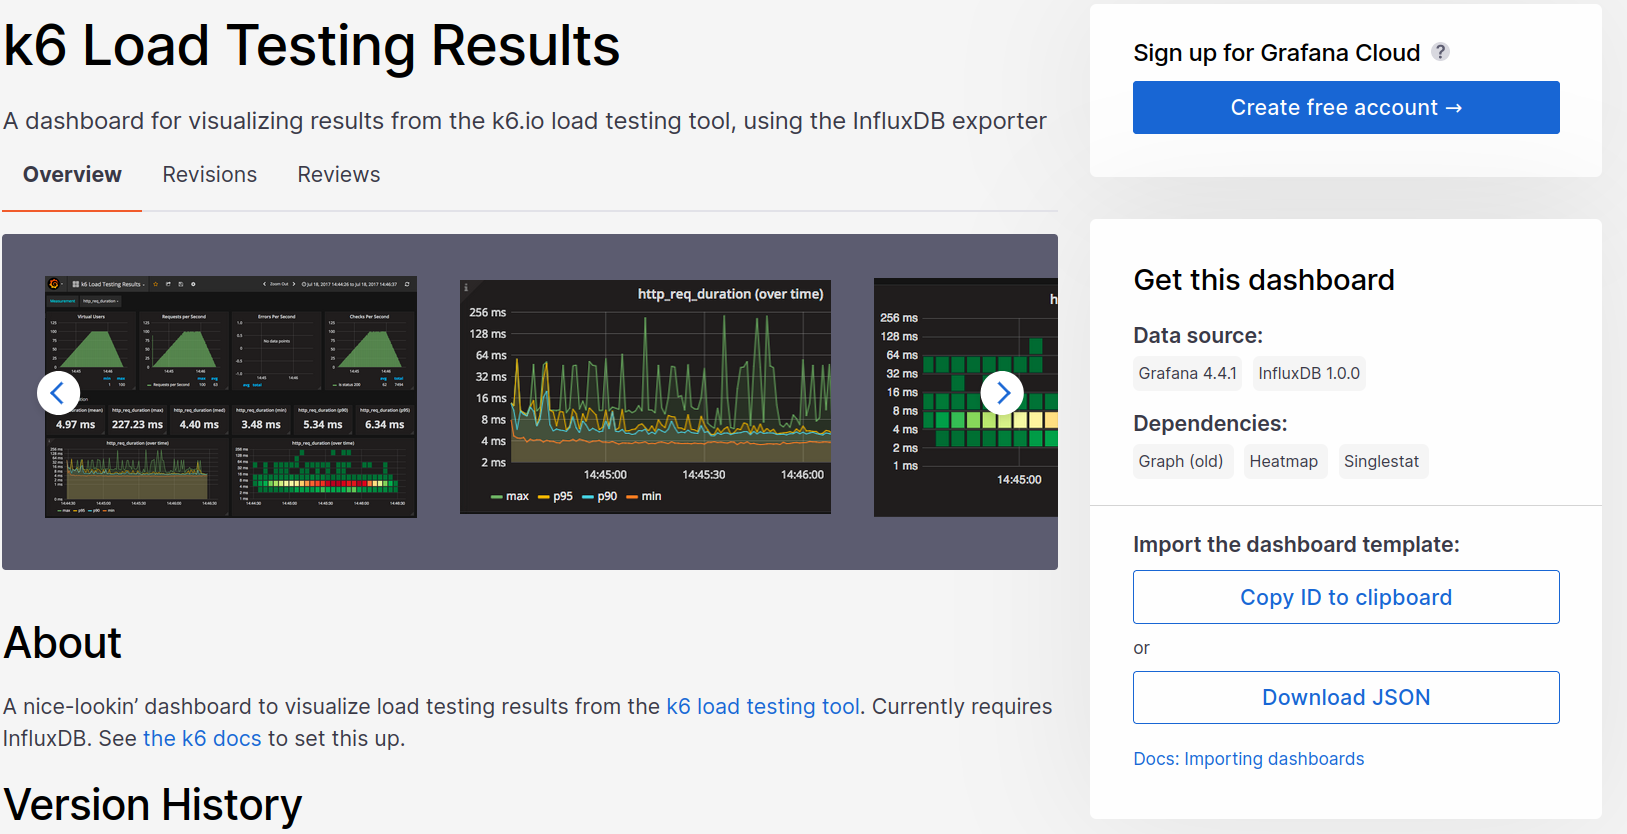
To view the k6 test metrics, you can create your own Grafana dashboard and customize your desired metrics. Check out this Grafana documentation for details on configuring the Grafana dashboard. To make the integration amongst k6, InfluxDB, and Grafana smoother, k6 has already provided the k6-InfluxDB-Grafana template for you.
From your browser, navigate to Grafana dashboard template for integrating between k6 and InfluxDB and click on “Copy ID to clipboard” to get the Grafana template ID.
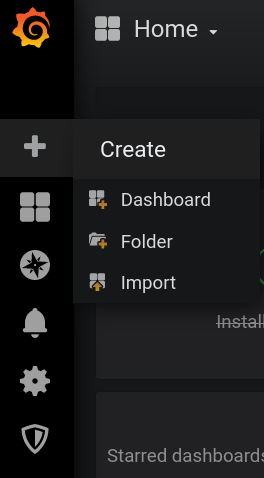
Then, from the Grafana homepage, click on “Create button” and choose “Import” to import the above template.
Enter the Grafana template ID into the ID textbox and load, you should see the following screen:

Choose the “InfluxDB” option in the k6 input box, then click “Import”. You should now be able to see the load test metrics.
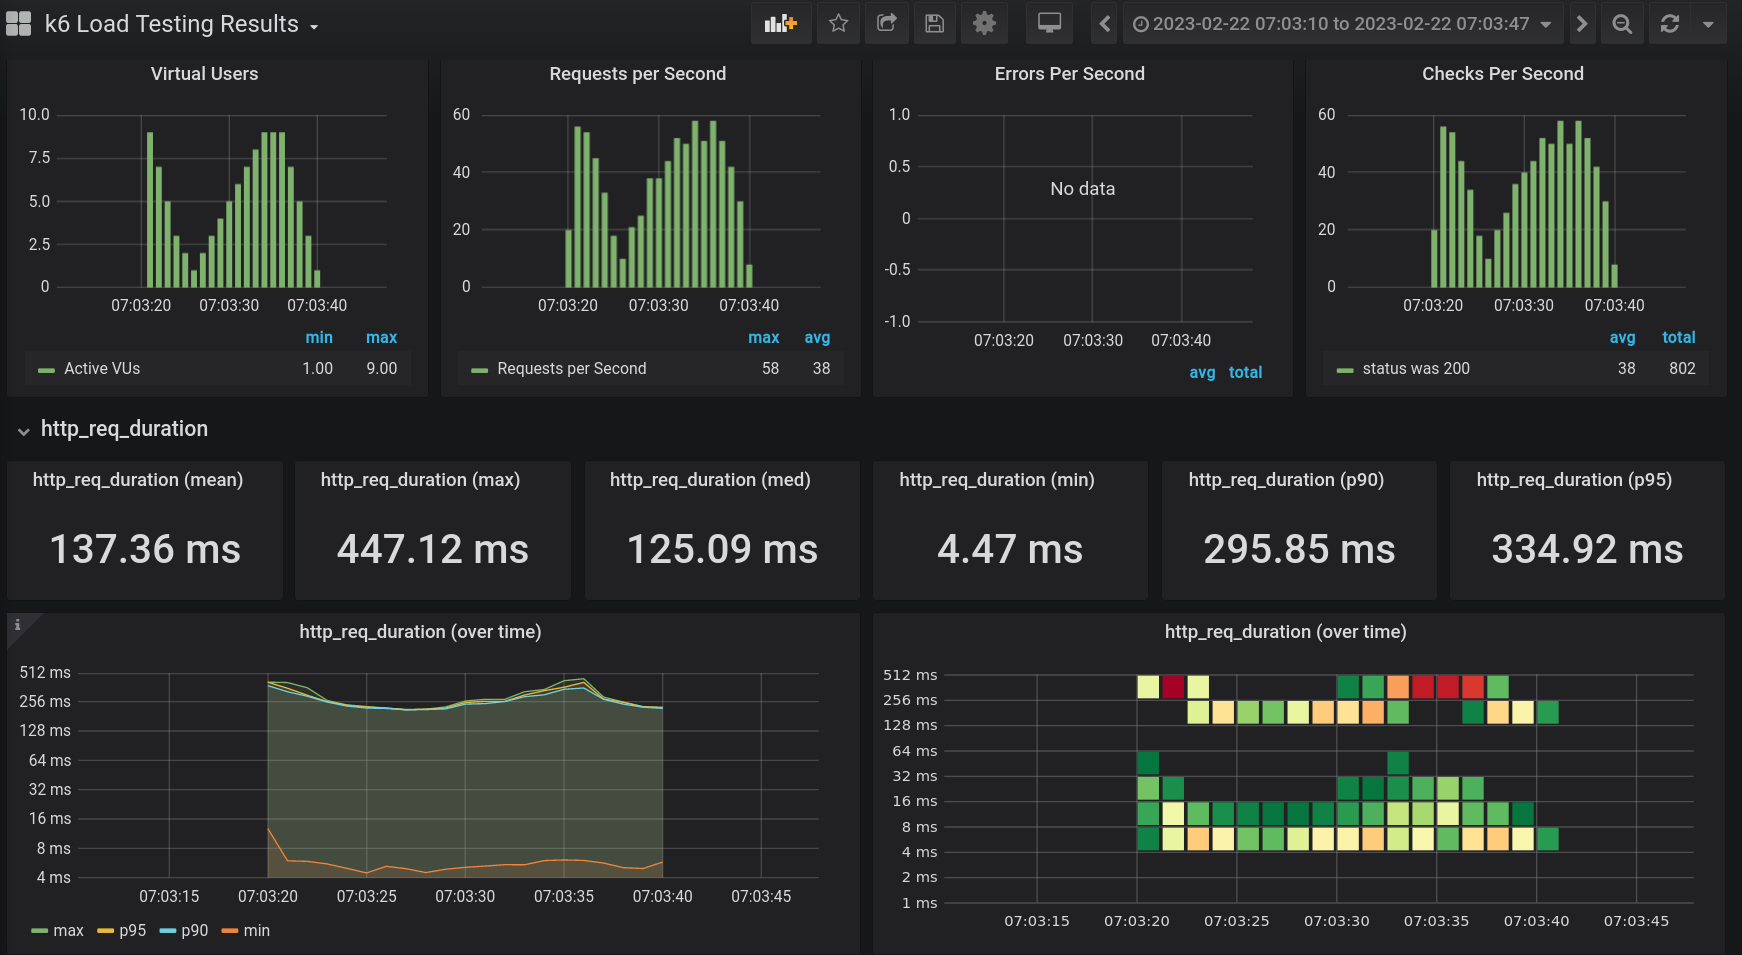
Here you have the visualization metrics for the number of “Virtual Users”, “Requests Per Second”, “Checks Per Second” along with a graph for showing HTTP duration metrics over a range of time so that you can get an idea of what went wrong at a particular time in your test.
By having a visualization dashboard for load testing, you can monitor your load test flexibly, whether in real-time or by checking out the test that happened five days ago.
Conclusion
Your app isn’t just about functionality; it needs to perform well to keep your users happy. We’ve shown you how to load test your backend service with k6 to ensure it can handle the heat. This is your launchpad into the world of load testing.
But what about streamlining your build process? If you’re eager to optimize this aspect of your development, give Earthly a spin. It might be just what you need to make your builds more efficient and reliable.
Want more on load testing? Dig into k6 docs for info on browser testing, chaos testing, and more.
Turn your engineering standards into automated guardrails that provide feedback directly in pull requests, with 100+ guardrails included out of the box and support for the tools and CI/CD systems you already have.